
Today’s post is a bit of a departure for Data on the Rocks. Instead of simply presenting some data with an accompanying analogy, this post is a statistical prediction. The Academy Awards are this Sunday, and the big question as always is which film is going to win Best Picture. The Oscars are notoriously hard to predict, with an eclectic voting body and an atypical voting process. Plus, who can forget the drama last year when La La Land was incorrectly announced as Best Picture instead of the true winner, Moonlight? This animated graphic shows the predicted winner of Best Picture from a statistical model. The model is based on many factors including: the Rotten Tomatoes “All Critics” and “Top Critics” scores, Oscar nominations for other categories, and other major awards nominations/wins. Each point represents the best guess for the probability of a win, and the grey bars represent the uncertainty. After the Golden Globes, Three Billboards Outside Ebbing, Missouri appeared to be the heavy favorite; however, this came with a high degree of uncertainty. The Shape of Water then racked up some wins with the Critics Choice, Producers Guild, and Directors Guild Awards which are historically pretty good predictors of the Oscars top prize. After all the dust settled, The Shape of Water is the modest favorite with around a 50% chance of winning but followed closely by Three Billboards with around a 30% chance.
3D Movies
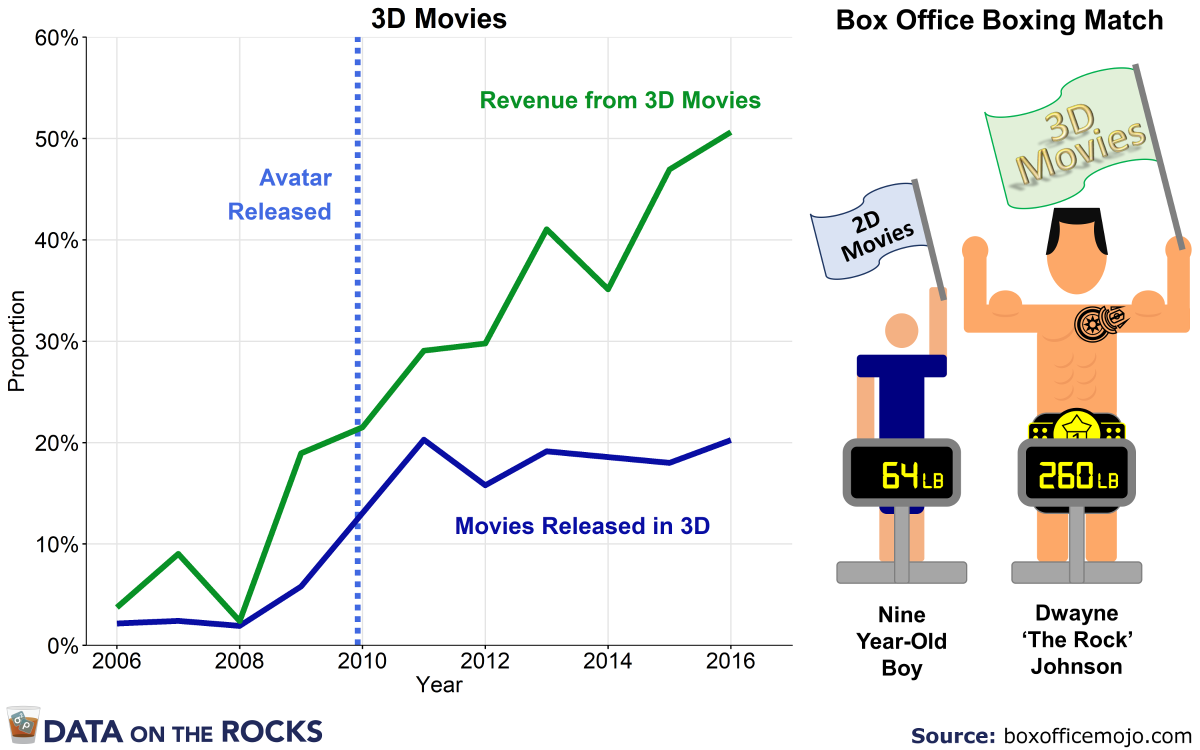
Since the release of Avatar, it seems like there has been an explosion of movies being released in 3D. And with a hefty surcharge for 3D movie tickets, it is not hard to understand why. But is it true that more and more movies are being released in 3D? And are these movies really dominating the movie industry? On the left, you can see the proportion of movies that were released in 3D from 2006 to 2016, and the revenue generated from those movies. The number of movies being released in 3D has actually been fairly stable since 2011, about a year after Avatar’s release. The revenue from those 3D movies however has continued to skyrocket. In 2016, 3D movies accounted for only 20% of movie releases, but brought in just over 50% of the box office revenue. That means that the average 3D movie brings in 4x the revenue as an average 2D movie. In terms of a box office boxing match, this is equivalent to Dwayne ‘The Rock’ Johnson, the highest earning actor in 2016, facing off against a 9-year old boy.
Presidential Elections
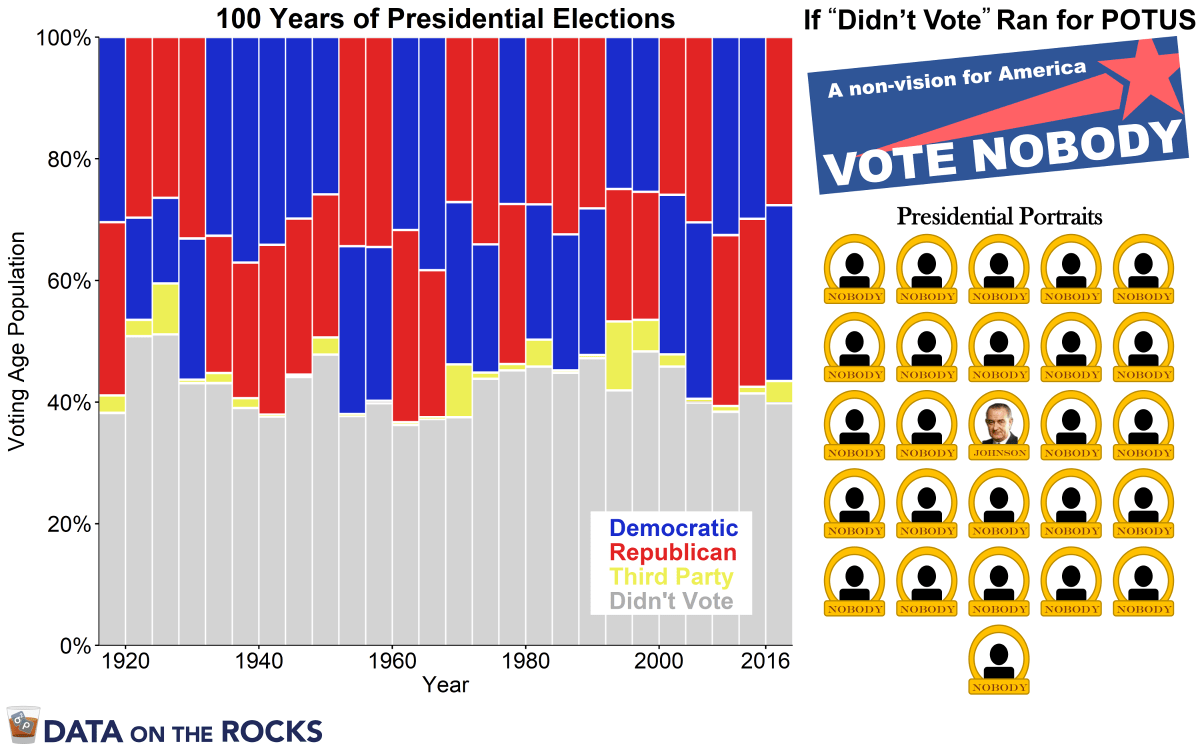
On the one-year anniversary of the 2016 presidential election it is worth looking back at the history of American presidential democracy. One disheartening feature of our democracy is the fact that, compared to many other democratic nations, voter turnout in America is very low. The graph on the left shows the number of votes the Republican, Democratic and combined third party candidates received as a percentage of the total voting age population. Since 1916, only 57% of eligible voters on average cast a ballot for president. As a result, the president is decided by only 30% of eligible voters on average, far less than a majority of the population. If “didn’t vote” was treated as a candidate, Candidate Nobody, she would have won every single election of past 100 years with the sole exception of losing to Lyndon B. Johnson in 1964. American citizens who care about the future of their country need to get informed, motivated and voting. And not just every four years for president. Every election matters.
Global Warming
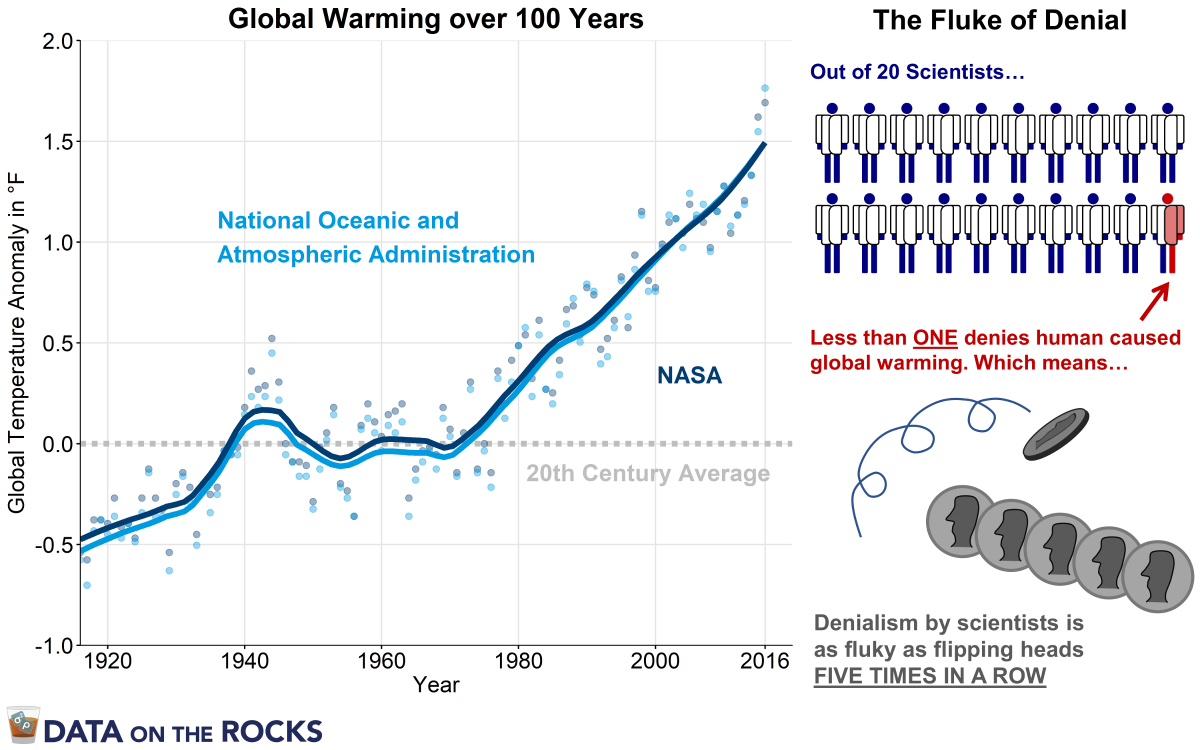
As summer approaches and Trump considers withdrawing from the Paris Climate Agreement, it is worth looking at some data on global warming. The graph on the left shows global temperature change over the past 100 years measured by both NASA and the National Oceanic and Atmospheric Administration (NOAA). Though the temperature bounces around year-to-year, the overall trend is clearly a steady and dramatic rise from about 1970 on. Based on these and other data, a staggering 97% of climate scientists and scientific studies endorse human-caused global warming that is directly related to CO2 and other greenhouse gases. This scientific consensus means that finding a climate scientist who denies human-caused global warming is just as fluky as flipping a coin five times, and getting heads each and every time. In stark contrast, only 69% of Democrats and a mere 23% of Republicans agree with this scientific consensus.
Science Funding
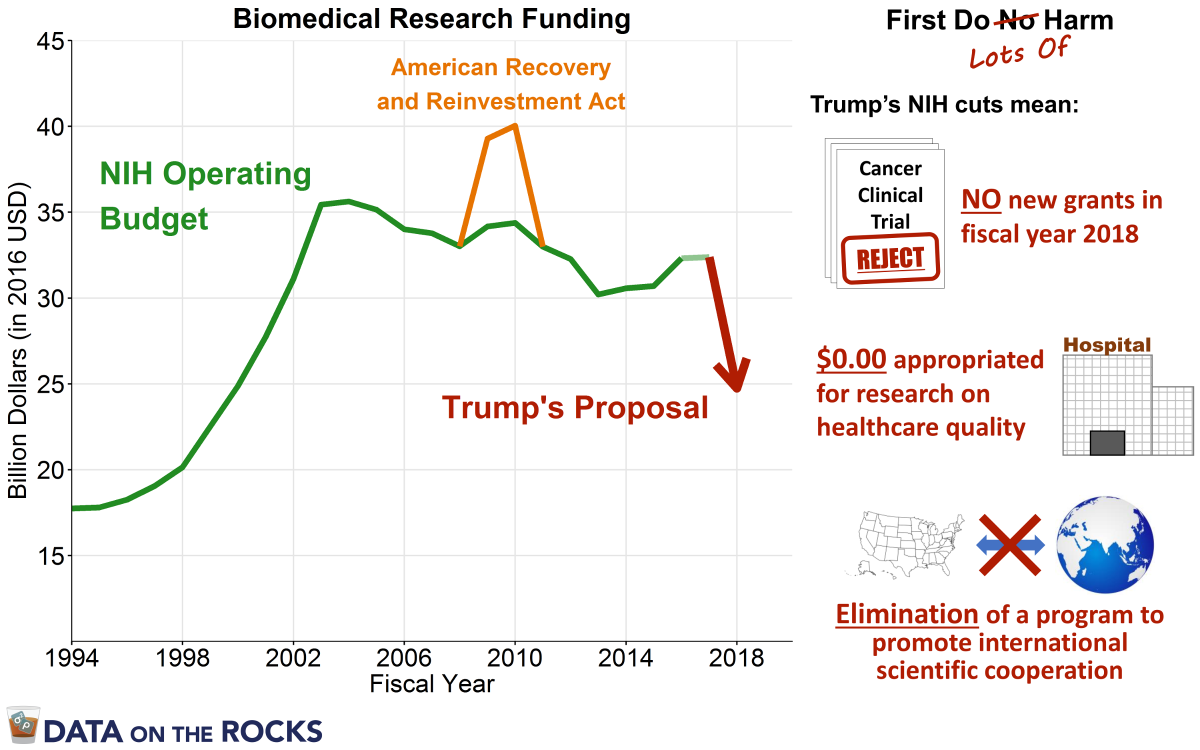
Yesterday, tens of thousands of people across the United States and the world marched in support of scientific research at the March for Science. This march took place almost exactly a month after President Trump revealed his budget request to Congress. Trump’s budget included startling cuts to nearly all scientific research agencies including the National Institutes of Health (NIH). The NIH is the largest biomedical research organization in the world. NIH directly employs over 5,000 of the world’s smartest biomedical researchers, and through scientific grants, is the backbone for biomedical research across the country. The graph on the left shows the operating budget of the NIH from 1994 to today (inflation adjusted), including the effect of the American Recovery and Reinvestment Act and Trump’s proposed $6+ billion cut. The negative consequences of Trump’s proposal are frankly hard to overstate. To start, there would be no funding available for new grants in fiscal year 2018. No money would be allocated to study healthcare quality. And a program vital to fostering international collaboration would be eliminated. As Kathy Hudson, a former deputy director at NIH put it to the American Association for the Advancement of Science, “The nation would lose research and researchers in a way that would not be recoverable.”
Marijuana
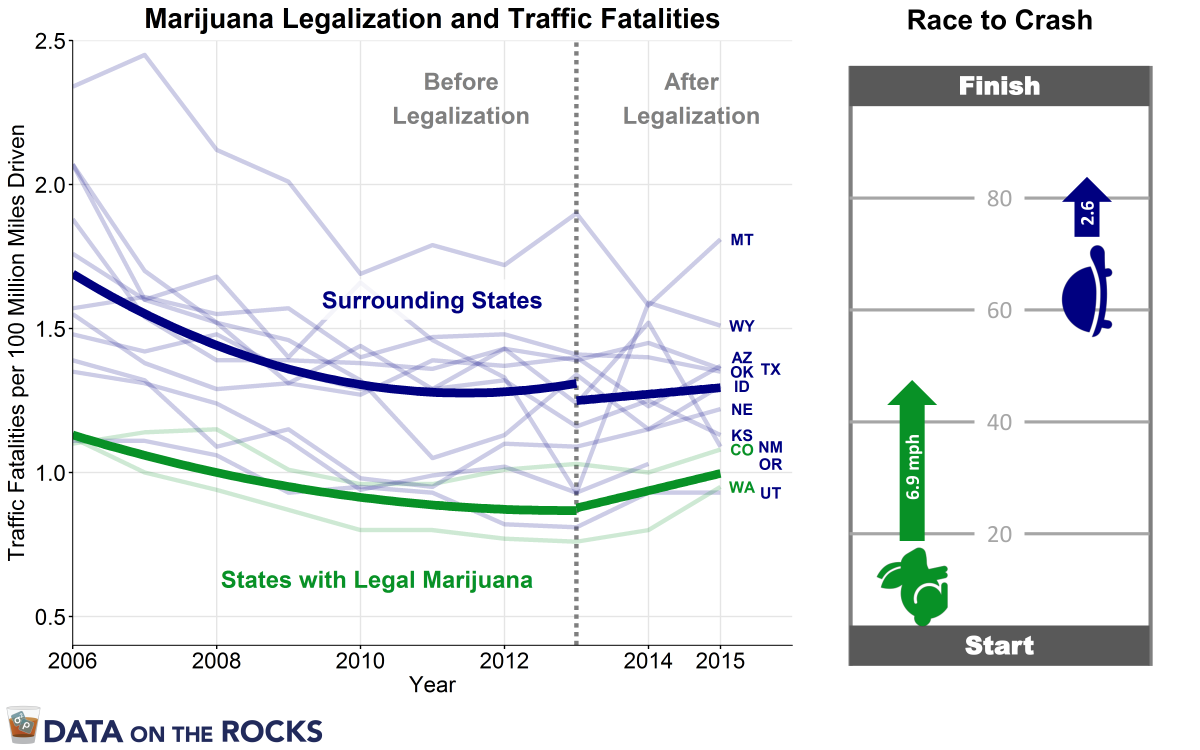
Support for legalizing recreational marijuana has been steadily growing for decades. Last November, California, Nevada, Massachusetts and Maine voted to legalize recreational marijuana for people age 21 or older. Leading up to the election, voters were inundated with arguments from both sides of the debate. One of the most convincing argument against legalization was the risk for increased traffic accidents and fatalities. The graph on the left shows traffic fatality rates in the only two states with multiple years of legal recreational marijuana, Colorado and Washington, versus surrounding states. Although Colorado and Washington had about 30% lower rates of traffic fatalities in general, since legalization their fatality rates have increased 2.7x more quickly than surrounding states. This means that if these trends hold, by 2023 the rates will converge. In terms of an apocryphal tortoise and hare race across a football field, this would be like starting the tortoise at the 63-yard line, but the hare is going 6.9 miles per hour to the tortoise’s 2.6. So please remember not to drive under the influence of any drug including marijuana (and especially alcohol).
Find the Phony
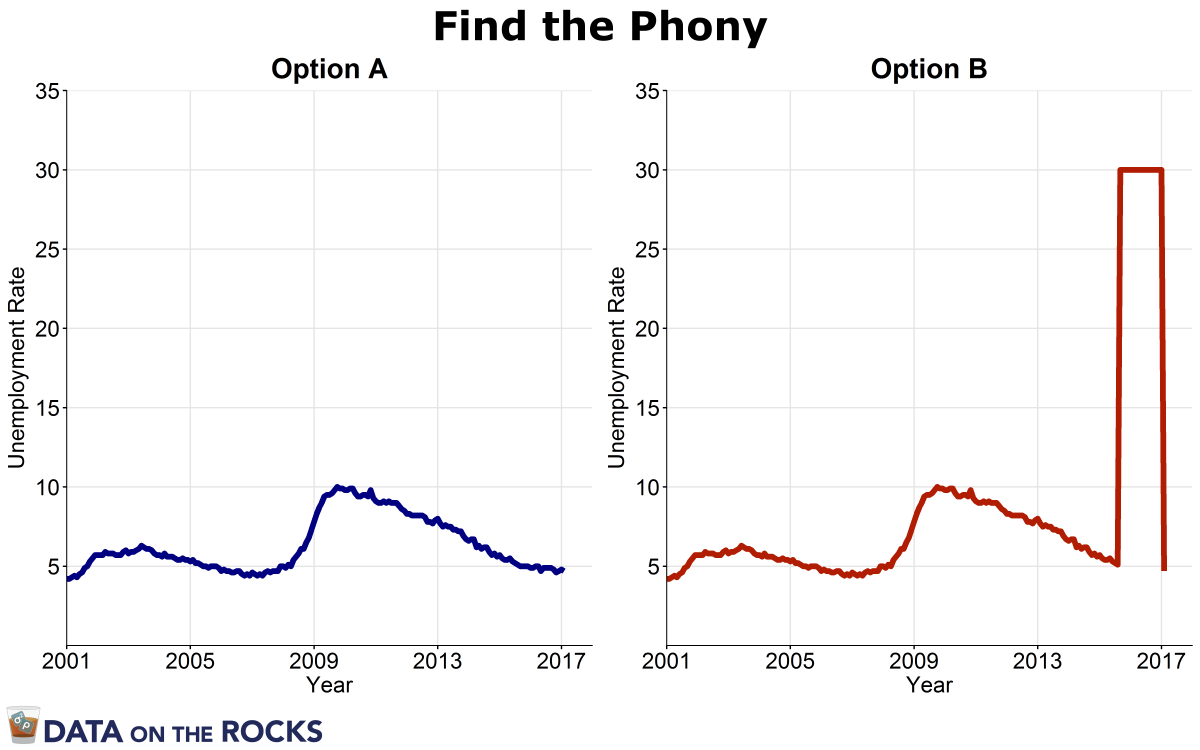
It’s time to play a fun and challenging new game called Find the Phony where we all try to guess which unemployment data is phony. Is it Option A courtesy of the Bureau of Labor Statistics, or Option B courtesy of Trump et al? Feel free to post your answers in the comments.
Crime
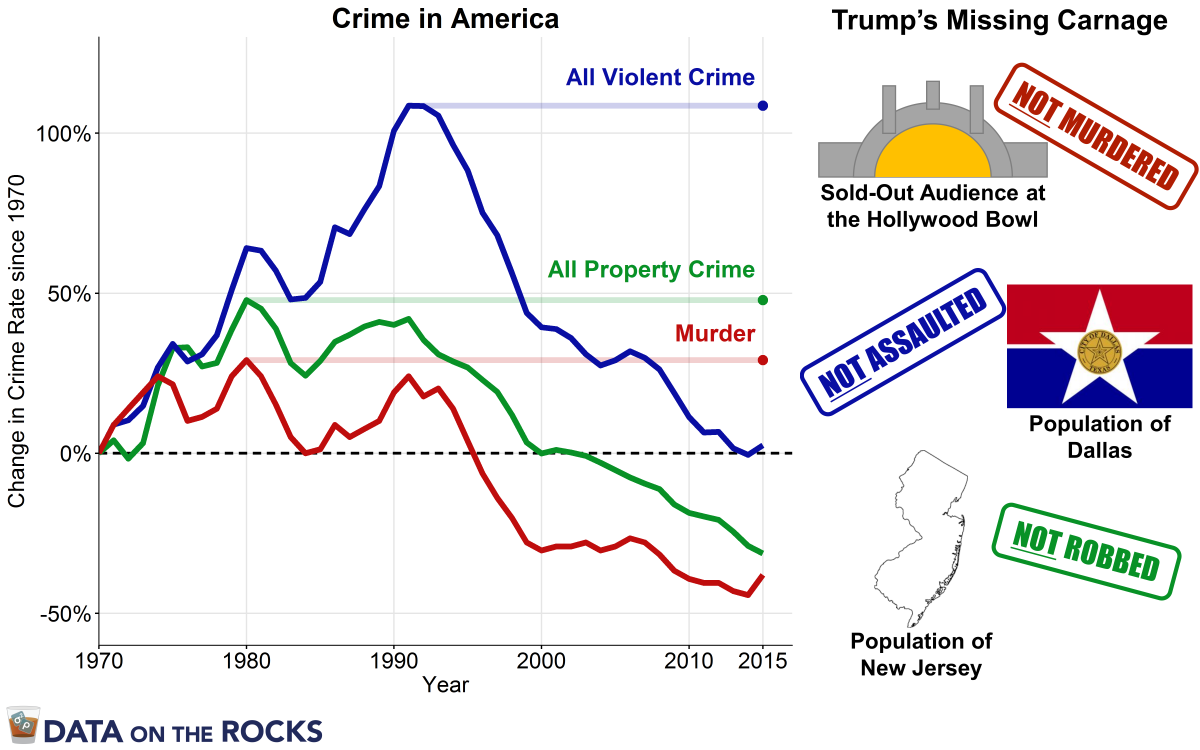
Donald Trump ran for president promising a return to law and order, a pledge which was supported largely by falsehoods. As president, he has repeated these claims, stating that the murder rate in America is the highest it’s been in the past 45-47 years. In fact, the murder rate has been consistently low since the early 2000’s, and crime rates overall have been steadily declining since the early 1990’s. The graph on the left shows the percent change in rates for murder, all violent crime, and all property crime from 1970 to 2015 (the last year complete data is available). To show how much lower the current rates are compared to the highest levels of the past 45 years, the graph also projects these highest levels out to 2015 for easy visual comparison. In order for today’s rates to reach those historic highs, and for Trump’s claim about murder in America to be correct, an entire sold-out audience at the Hollywood Bowl would need to be murdered (over 17,000 people). To match the highest rates of all violent crime, the entire population of Dallas would need to be assaulted (over 1,200,000 people), and to match the highest property crime rate, the entire population of New Jersey would need to be robbed (over 9,000,000 people).
Travel Ban
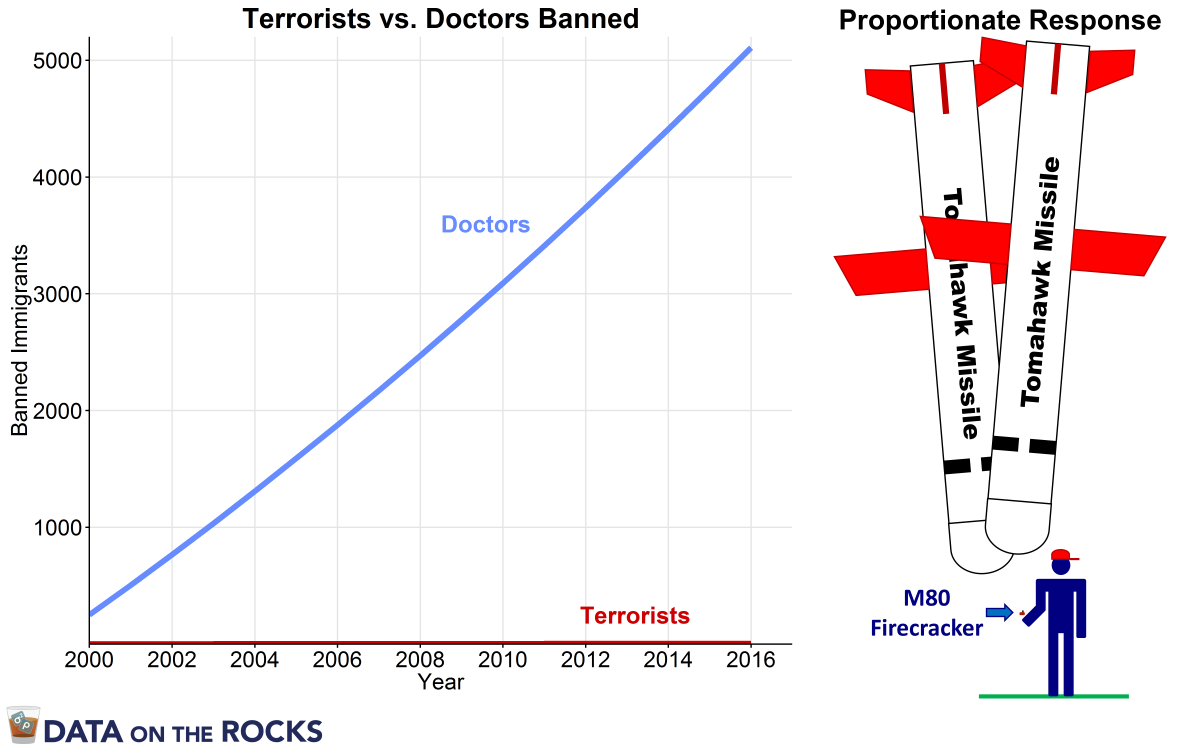
A mere seven days into his presidency, Donald Trump signed an executive order banning immigration and travel from seven majority-Muslim countries: Iran, Iraq, Libya, Syria, Somalia, Sudan and Yemen. Although the executive order is currently being contested in court, it is still on the books and is continuing to affect the lives of those seeking refuge and immigration. Trump claims this executive order was intended to protect the nation, but it would likely hurt Americans overall. The graph on the left shows the effect of an immigration ban on these same countries had it been implemented in 2000, before the September 11th attacks. This immigration ban would have blocked three terrorism events which injured a total of thirty people and killed zero. It would have also blocked immigration for over 5000 doctors, each one of whom does 17 times more to improve the lives of Americans every year than all the terrorists cost put together! For a comparison, this is like trying to stop your teenage neighbor from setting off a single M80 firework by hitting him with not one, but two Tomahawk cruise missiles!
Unemployment
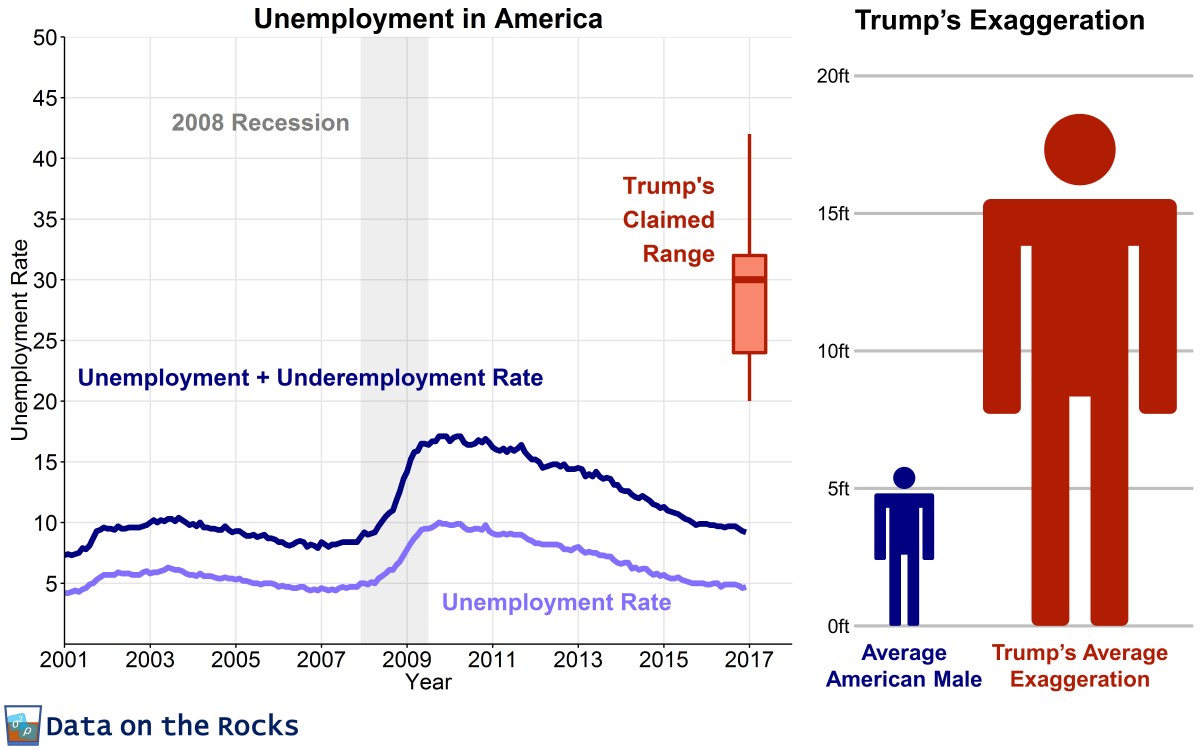
As a candidate and as president, Donald Trump has made wildly exaggerated claims about unemployment in America. The graph on the left shows the unemployment rate since 2001 and, for a broader measure of those seeking work, the graph also shows the rate of unemployment plus underemployment*. As of last month, these two rates are 4.7% and 9.2% respectively. Trump, on the other hand, has claimed rates ranging from 20% to 42%. By this degree of exaggeration, Trump would claim that the average height of an American male (about 5′ 10″ in reality) is over 18 feet tall! And that’s giving Trump the benefit of the doubt that he includes underemployment. If his claims are about only unemployment, it’s as if Trump is claiming the average American male is over 36 feet tall!
* The unemployment plus underemployment rate is the broadest unemployment measure. It includes those who are unemployed, those who are so economically discouraged that they have stopped seeking employment, and those working part-time who wish they were working full-time.
